Showing posts with label Technical Analysis. Show all posts

Tuesday, September 20, 2022

新型图表:雨滴图表 (Raindrop chart)


使用技术面的朋友,大部分是用“蜡烛”型图表。当前最受欢迎的图表是:

● Traditional Japanese Candlesticks

● Hollow Candlesticks

● Heikin Ashi

● Renko

现在有一款新型图表,叫「雨滴图表」(Raindrop chart)。这款图表远看与蜡烛图表很相似,zoom in 近看就很大分别。「雨滴图表」主要是针对大部分技术图表的盲点,“量”(volume)。很多量价技术派朋友会嵌入“量”图,但是,只是根柱子型的Histogram 图表无法有效表达市场情绪。「雨滴图表」是由TrendSpider 的联合创办人Ruslan Lagutin 针对这些痛点改良发明。

Sunday, March 25, 2018

技术上又进入熊市

3月22日,23日(星期四,星期五),DJI连续两天跌,共超过1000点!

从最高点26,616 跌到现在23,533,共跌了11.6%,近年来少有那么大的跌幅。 技术上又进入熊市。也跌低于2月初的23,860,接近200天MA。


Wednesday, July 10, 2013

FREE Stock Market Software

Nice software to share, easy to use.


Features:
Stock Watchlist
Portfolio Management
Stock Alert
Indicator Filter
Stock Charting
Cloud Storage
Currency Exchange
Andriod available

Friday, February 1, 2008

DJI Rebound


On 31-1-2008, MACD and RSI of DJI's daily chart shown rebound signal. This is time to entry market.

Wednesday, December 19, 2007

TA: Relative Strength Index (RSI)

The Relative Strength Index (RSI) is an extremely useful and popular momentum oscillator. The RSI compares the magnitude of a stock's recent gains to the magnitude of its recent losses and turns that information into a number that ranges from 0 to 100.

Calculation


Overbought/Oversold
Wilder recommended using 70 and 30 and overbought and oversold levels respectively. Generally, if the RSI rises above 30 it is considered bullish for the underlying stock. Conversely, if the RSI falls below 70, it is a bearish signal. Some traders identify the long-term trend and then use extreme readings for entry points. If the long-term trend is bullish, then oversold readings could mark potential entry points.

Divergence
Buy and sell signals can also be generated by looking for positive and negative divergence between the RSI and the underlying stock. For example, consider a falling stock whose RSI rises from a low point of (for example) 15 back up to say, 55. Because of how the RSI is constructed, the underlying stock will often reverse its direction soon after such a divergence. As in that example, divergences that occur after an overbought or oversold reading usually provide more reliable signals.

Centerline Crossover
The centerline for RSI is 50. Readings above and below can give the indicator a bullish or bearish tilt. On the whole, a reading above 50 indicates that average gains are higher than average losses and a reading below 50 indicates that losses are winning the battle. Some traders look for a move above 50 to confirm bullish signals or a move below 50 to confirm bearish signals.


Example:


The DJI example shows a number of extreme readings as well as a negative divergence. In Mar-2007, RSI reached oversold for a brief moment to mark the low around 25. The next extreme reading (overbought) occurred after April and continue sustain above level 70 until June. Then it was moving sideway after a large advance that peaked in July-2007. The next positive divergence reading occurred in August. for another brief moment and marked the low around 35. In early of September, RSI moved back above 50 and into overbought territory in October. A negative divergence formed in first week of October and marked the high in the upper fifties. Then it moved down to level 30.

Saturday, December 1, 2007

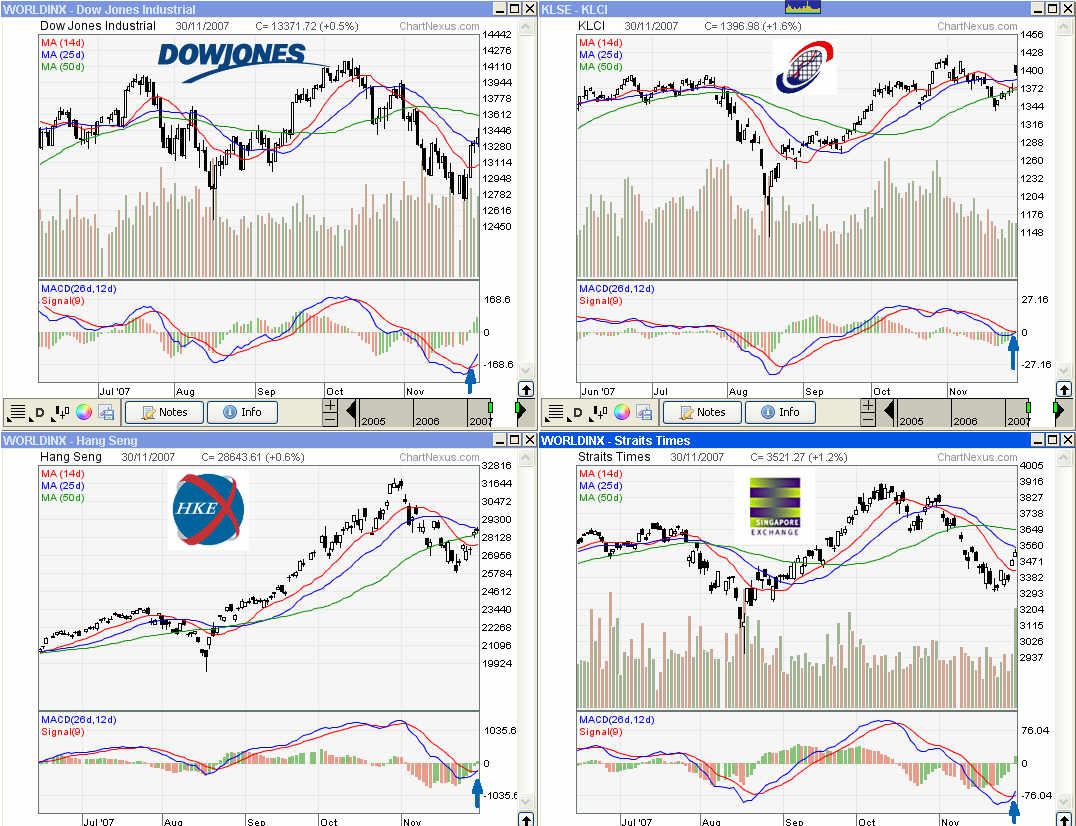
World Market Rebound

(Source: Chartnexus)

Dow Jones Industrial was rebound and up consecutive 4 days after Citigroup secure capital from Abu Dhabi Fund invesment. Citigroup was rebound about 10% in this period. In most world market index MACD shown rebound signal; DJI, Nasdaq, S&P 500, HSI, Nikkei 225, STI, KLCI.

Monday, October 22, 2007

TA: MACD

Moving Average Convergence Divergence (MACD). Common MACD is calculated by subtracting the 26-day exponential moving average (EMA) from the 12-day EMA.

Indicators of MACD:
1. Crossovers - when the MACD falls below the signal line, it is a bearish signal, which indicates that it may be time to sell. Conversely, when the MACD rises above the signal line, the indicator gives a bullish signal.

2. Divergence - When the security price diverges from the MACD. It signals the end of the current trend.

MACD can combined use with Fibonacci retracement. See example below:

Saturday, October 20, 2007

TA: Fibonacci Retracement

Fibonacci retracement is a very popular tool among technical traders and is based on the key numbers identified by mathematician Leonardo Fibonacci. In technical analysis, Fibonacci retracement is created by taking two extreme points (usually a major peak and bottom) on a stock chart and dividing the vertical distance by the key Fibonacci ratios of 23.6%, 38.2%, 50%, 61.8% and 100%.

Example recent KLCI chart


Steps of construct Fibonacci retracement
1. Identify major market trend; up or down
2. For major up trend, select from peak to bottom
3. Fibonacci retracement ratio: 38.2%, 50% and 61.8% (Golden level)

Support level 1: 1291, level 2: 1262
Strong support level: 1237

Thursday, September 27, 2007

Technical Analysis Tool

To learn stock investment you may need a analysis tool

FREE Stock analysis software
http://www.chartnexus.com/
Snapshot


FREE register
FREE software, no license required
FREE and automatic update to date data (EOD)
FREE 3 year stock history data of KLSE, STI(singapore), BSE (india)
FREE 3 year data of major world indices; Dow Jones Indus., Nikkei 225, Heng Seng, Shanghai Stock Ex., Nasdaq, S&P500...........
10 year history data is RM80. If you want to save cost, 3 year data is efficient.