Sunday, December 30, 2007

2008 KLCI TARGET TO TOP 1,650!


2008 target @1,650 with baseline target @1,520. Based on our model, we have ascribed 1,650 points as our target for 2008, translating to a market price earnings ratio (PER) of 17x. From a bottom-up approach, our target is set at 1,520 or at mar ket PER of 15.6x, which also forms our baseline target for 2008. We believe our target is tangible given that the TMT (Tenaga Nasional Bhd, Malayan Banking Bhd and Telekom Malaysia Bhd), which have grossly underperformed the CI in 2007, is likely to support the uptrend of the market.


These counters collectively account for about 16% of the CI's total market cap and are at present bogged down by their respective niggling doubts, but should these uncertainties be alleviated, we reck on buying interests should flow back into these stocks. See table for a scenario whereby 1,650 points may be achieved.

(Source: OSK Research)

Wednesday, December 19, 2007

TA: Relative Strength Index (RSI)

The Relative Strength Index (RSI) is an extremely useful and popular momentum oscillator. The RSI compares the magnitude of a stock's recent gains to the magnitude of its recent losses and turns that information into a number that ranges from 0 to 100.

Calculation


Overbought/Oversold
Wilder recommended using 70 and 30 and overbought and oversold levels respectively. Generally, if the RSI rises above 30 it is considered bullish for the underlying stock. Conversely, if the RSI falls below 70, it is a bearish signal. Some traders identify the long-term trend and then use extreme readings for entry points. If the long-term trend is bullish, then oversold readings could mark potential entry points.

Divergence
Buy and sell signals can also be generated by looking for positive and negative divergence between the RSI and the underlying stock. For example, consider a falling stock whose RSI rises from a low point of (for example) 15 back up to say, 55. Because of how the RSI is constructed, the underlying stock will often reverse its direction soon after such a divergence. As in that example, divergences that occur after an overbought or oversold reading usually provide more reliable signals.

Centerline Crossover
The centerline for RSI is 50. Readings above and below can give the indicator a bullish or bearish tilt. On the whole, a reading above 50 indicates that average gains are higher than average losses and a reading below 50 indicates that losses are winning the battle. Some traders look for a move above 50 to confirm bullish signals or a move below 50 to confirm bearish signals.
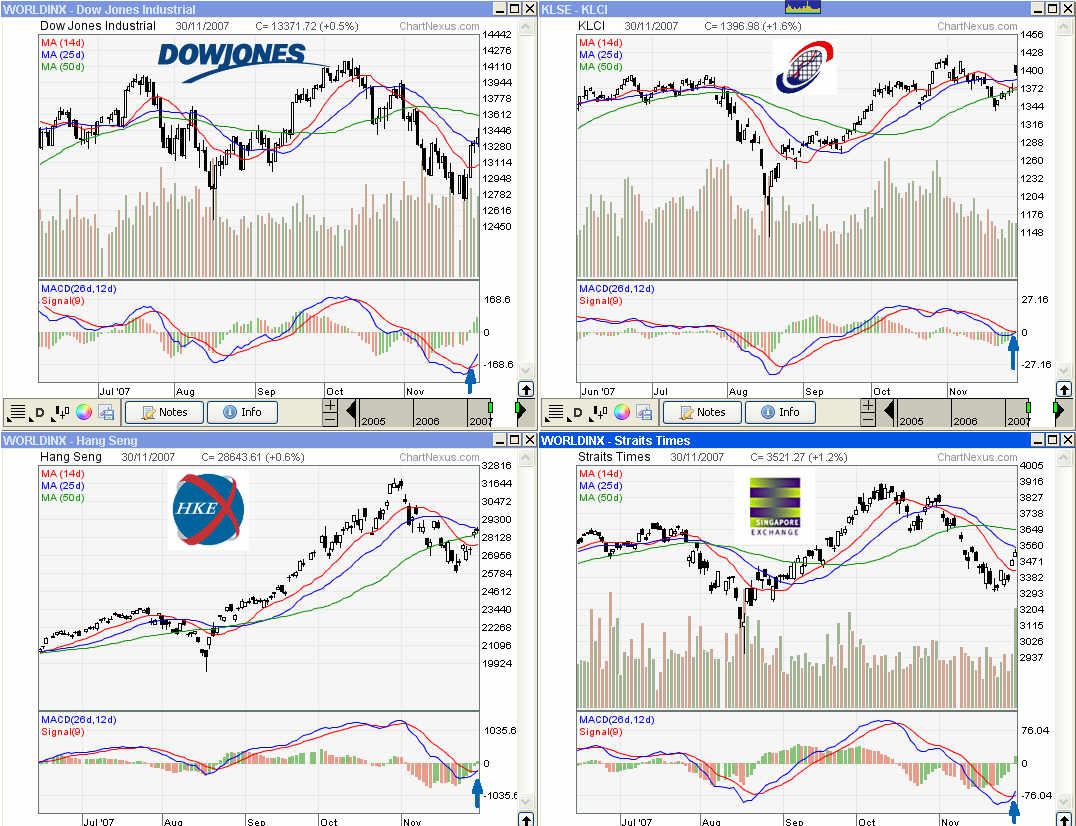

Example:


The DJI example shows a number of extreme readings as well as a negative divergence. In Mar-2007, RSI reached oversold for a brief moment to mark the low around 25. The next extreme reading (overbought) occurred after April and continue sustain above level 70 until June. Then it was moving sideway after a large advance that peaked in July-2007. The next positive divergence reading occurred in August. for another brief moment and marked the low around 35. In early of September, RSI moved back above 50 and into overbought territory in October. A negative divergence formed in first week of October and marked the high in the upper fifties. Then it moved down to level 30.

Sunday, December 9, 2007

Bursa may tie up with CME

The world's largest and most diverse financial exchange, the Chicago Mercantile Exchange (CME) may buy a 10% stake in Bursa Malaysia. Both exchanges are in talks to form a tie up that will involve the trading of CPO derivatives on CME.

The deal is currently being thrashed out by the relevant parties and is likely to be announced close to Christmas. The price tag for the sale, says a source, is within the RM20 per share range. (The counter closed Friday at RM14.20).

Government agencies or institutions own about 38% interest in Bursa Malaysia. The Minister of Finance Inc and the Employees Provident Fund has own 19% and 3% respectively in the local exchange. Noteworthy and as an analyst points out, Bursa Malaysia has a high foreign shareholding of 40%.

Earlier, CME had a 50-50 joint venture with Singapore Exchange (SGX) to list commodity futures on a Singapore-based platform called Jade. However, in the middle of November this year, the CME group abandoned the project, selling its stake in the venture to the core owner SGX. The partnership has been terminated, which opened the door for talks between CME and Bursa Malaysia.


Other exchange like Dubai International Financial Exchange (DIFX), Dalian Commodity Exchange (DCE) (already tie up with Bursa to trade CPO in Dalian), and Euronext are keen to cooperate with Bursa.

Saturday, December 1, 2007

World Market Rebound

(Source: Chartnexus)

Dow Jones Industrial was rebound and up consecutive 4 days after Citigroup secure capital from Abu Dhabi Fund invesment. Citigroup was rebound about 10% in this period. In most world market index MACD shown rebound signal; DJI, Nasdaq, S&P 500, HSI, Nikkei 225, STI, KLCI.

Friday, November 30, 2007

BURSAPURSUIT GAME END

The virtual investment game; Bursapursuit was ended 30-11-2007.

The top gainer was 'Tiger Chan', age 57, Remiser with total value of RM1,107,600.74. 2nd top player also achieved RM 1,032,293.90. They make 4 folds from starting capital RM250,000. Well done. Congratulation!

There are total 43,092 people were register the game. There are 28% players are not active. The statistic below is ignored the non-active player.

There are 23% players were recorded gain (>RM250,000) at end of game. Only 0.66% players can make more than RM500,000. Then 2.44% players recorded 20% gain, 20% player gain less than 20%.

However, total 77% players were losing their investment. there were 20% player lost more than 20% of their capital.


(if you interest the full data, pls drop me a message. I will send you the data.)

Thursday, November 15, 2007

World Bank Upgrade East Asia Growth Despite U.S. Slow Down


East Asian economies are likely to remain robust in 2008 despite growing concerns about the U.S. sub-prime crisis and increasing global oil prices, says the World Bank’s latest East Asia & Pacific Update.

The Update – a six-monthly report on the region’s economic and social health – finds that growth in emerging East Asia1 is expected to exceed 8 percent in 2007 for a second year in a row and to moderate only slightly in 2008. Although East Asian exports to the US have already slowed, more buoyant investment and consumption in China and other countries have allowed growth to remain strong and even pick up this year.

China is expected to grow by 11.3 percent in 2007 and that is expected to slow only modestly to 10.8 percent in 2008. The stronger growth dynamic extends to middle-income economies in South East Asia and continues to run at solid 7 percent to 10 percent rates in low-income economies of the region including Cambodia, Lao PDR, Mongolia and Vietnam. Growth is also running at above historical trends in some of the small Pacific Island economies due to high commodity prices although social tensions and political instability continue to undermine performance in some of these countries.

Wednesday, November 14, 2007

No Sen on 1-April-2008

The Government's rounding mechanism for over-the-counter transactions will be fully implemented by April 1. All payment totals will either be rounded up or down to the nearest five sen.

Domestic Trade and Consumer Affairs Minister Datuk Shafie Apdal said this move would benefit consumers, businesses and the Government.

Example:

Bill ends in sen

Round-off to the nearest 5 sen

1,2

0

3,4

5

6,7

5

8,9

10

Monday, November 12, 2007

TOP 10 Bargain Stock


While the benchmark index has registered total returns (capital gains and dividend yield) of 29.6% year-to-date (YTD), there are 37 component stocks that have underperformed the index.

Here are 10 stocks selected by analyst to be consider.

1. ASTRO - Looking at the privatisation angle
2. PROTON - Will marriage be the answer
3. TENAGA - Long term value intact
4. KURNIA - A better tomorrow?
5. MAYBANK - A crouching tiger
6. HLBank - Ripe for the picking
7. EONCap - Target of M&A
8. TM - Breaking up to unleash value
9. DRB-HICOM - A restructuring play
10. PLUS - Moving towards a semi-growth stock

Sunday, November 11, 2007

Brazil found 8 Billion Barrels Oil

The government-run oil company Petroleo Brasileiro SA, or Petrobras, said the new "ultra-deep" Tupi field could hold as much as 8 billion barrels of recoverable light crude, sending Petrobras shares soaring and prompting predictions that Brazil could join the world's "top 10" oil producers.

Petrobras President Sergio Gabrielli said Thursday the oil from ultradeep areas, including the Tupi field, would give Brazil the world's eighth-largest oil and gas reserves.

Petrobras says the Tupi field, off Brazil's southeastern Atlantic coast, has between 5 billion and 8 billion barrels -- equivalent to 40 percent of all the oil ever discovered in Brazil.

Brazil's total oil reserves currently rank 17th in the world, with 14.4 billion barrels of oil equivalent, Gabrielli said.


Thursday's news of the discovery rocked a country that became a net oil exporter only last year but must still import light crude oil for the refined products it needs. Brazil produces -- and exports -- mostly heavy crude oil, which has to be mixed with the light oil in refineries.


Petrobras' American depository shares jumped $24.03 to $116.77 on the New York Stock Exchange to close at a 52-week high. In Brazil, Petrobras shares ended 14.1 percent higher Thursday at 80.17 reals ($45.94) in Sao Paulo.


The Tupi field lies under 2,140 meters (7,060 feet) of water, more than 3,000 meters (almost 10,000 feet) of sand and rocks, and then another 2,000-meter (6,600-foot) thick layer of salt. The company drilled test wells that lie under 2,166 meters (7,100 feet) of water, 286 kilometers (177 miles) south of Rio de Janeiro.

Monday, November 5, 2007

PetroChina 1st Firm Worth More Than $1 Trillion


PetroChina 's shares nearly tripled in their first day of trading in China today. The company became the world's first company worth more than $1 trillion on Monday, surging past Exxon Mobil.

PetroChina's new shares listed in Shanghai surged to 43.96 yuan Monday, nearly triple the IPO price of 16.70 yuan. (100 RMB = 13.4160 USD)

PetroChina current listed in Hong Kong Stock Exchange (0857.HK
), New York Stock Exchange (PTR.N), and Shanghai Stock Exchange (601857.SS)


KLSI, 2nd Board & Mesdaq Index retired

2nd Board Index => FTSE Bursa Malaysia Second Board Index

MEASDAQ => FTSE Bursa Malaysia MESDAQ Index

Index/Sector Name

Number of Constituents

FTSE Bursa Malaysia 100 Index

100

FTSE Bursa Malaysia Second Board Index

228

FTSE Bursa Malaysia MESDAQ Index

124

Saturday, November 3, 2007

大连商品交易所棕榈油上市

10月29日,大连商品交易所棕榈油期货上市。


大连商品交易所棕榈油期货合约

交易品种

棕榈油

交易单位

10/

报价单位

元(人民币)/

最小变动价位

2 /

涨跌停板幅度

上一交易日结算价的4%

合约月份

1,2,3,4,5,6,7,8,9,10,11,12

交易时间

每周一至周五上午9:0011:30,下午13:3015:00

最后交易日

合约月份第10个交易日

最后交割日

最后交易日后第2个交易日

交割等级

大连商品交易所棕榈油交割质量标准

交割地点

大连商品交易所棕榈油指定交割仓库

最低交易保证金

合约价值的5%

交易手续费

不超过6/

交割方式

实物交割

交易代码

P

上市交易所

大连商品交易所

Thursday, November 1, 2007

Fed second cuts rates

Oct 31 - As expected, the Federal Reserve cut the Fed Funds rate, but its impact on ailing housing market remains uncertain.

Americans may find some relief because of the rate cut, but because it was expected, a lot of the impact was already factored into the market.

Friday, October 26, 2007

Crude Oil Hits Over $90


Oil roared to a new record over $90 on signs OPEC will shrug off calls for oil from big nations. Full Article from Reuters

Tuesday, October 23, 2007

林梧桐逝世


2007/10/23 云顶国际集团创办人丹斯里林梧桐逝世。 于1918年在福建安溪出生,19岁时南来吉隆坡,从买卖废铁和二手机械生意起家,在1964年的54之龄投下巨资,一手打造马来西亚最大休闲胜地——云顶高原。

“一个朋友好意劝我,如果我是做木材的,在乌鲁加里山搞伐木倒不失为一个好主意。 至于要把云顶发展为一个旅游胜地,就有点儿像天方夜谭。” 采自
林梧桐《我的自传》里,回忆当年开创云顶时。


国父一席话改变云顶:

林梧桐原本构想将云顶打造成一个供一家大小避暑玩乐的胜地。 在1969年3 月31日,云顶首家酒店高原酒店开幕当天,为酒店主持开幕的国父东姑阿都拉曼,在致词时说了一句改变云顶命运的话。 国父当年说,他对林梧桐在毫无政府资助的情况下开发云顶,为大马旅游业作出贡献而深受感动,因此政府将优先考虑让云顶开办赌场。 林梧桐也因为这句话,把云顶发展避暑胜地,也开办起赌场业。

Monday, October 22, 2007

TA: MACD

Moving Average Convergence Divergence (MACD). Common MACD is calculated by subtracting the 26-day exponential moving average (EMA) from the 12-day EMA.

Indicators of MACD:
1. Crossovers - when the MACD falls below the signal line, it is a bearish signal, which indicates that it may be time to sell. Conversely, when the MACD rises above the signal line, the indicator gives a bullish signal.

2. Divergence - When the security price diverges from the MACD. It signals the end of the current trend.

MACD can combined use with Fibonacci retracement. See example below:

Saturday, October 20, 2007

TA: Fibonacci Retracement

Fibonacci retracement is a very popular tool among technical traders and is based on the key numbers identified by mathematician Leonardo Fibonacci. In technical analysis, Fibonacci retracement is created by taking two extreme points (usually a major peak and bottom) on a stock chart and dividing the vertical distance by the key Fibonacci ratios of 23.6%, 38.2%, 50%, 61.8% and 100%.

Example recent KLCI chart


Steps of construct Fibonacci retracement
1. Identify major market trend; up or down
2. For major up trend, select from peak to bottom
3. Fibonacci retracement ratio: 38.2%, 50% and 61.8% (Golden level)

Support level 1: 1291, level 2: 1262
Strong support level: 1237

Saturday, October 13, 2007

Average Daily Turnover

Bursa Malaysia announced third quarter period ended 30 September 2007 result net profit more than double (jump 123%) to RM56 million recorded for the corresponding period in the previous year.

Singapore Exchange also record highest quarterly net profit SGD$130 million which represents a 173% growth as compared to the corresponding period ended 30 September 2007.


Above show average daily turnover of quarter which ended 30 September 2007 of few Asian market. The average daily turnover in KLSE has growth 145% as compared to the corresponding period. The average turnover of Singapore also improved 86% for corresponding period. However, Heng Seng was showing big jump more than 500% of average daily turnover in the period. Hong Kong Exchange will announce the third quarter result on 14 November 2007. No doubt that , it will be few folds of its net profit.

Wednesday, October 10, 2007

Saturday, October 6, 2007

Can You Make 4 Folds of Your Money in 5 Days


"You have ifs, Bursa has answers"

The BursaPursuit investment game has started 5 days. An expert was making RM 1 million in five days. How to do it.

Wednesday, October 3, 2007

How do you invest if you have RM250,000?


How do you invest if you have RM250,000?

A Virtual Investment Game

An investment Challenge Game that mimics Bursa Malaysia. Pit your skills against other virtual investors to win over RM500,000 worth of prizes*! The Challenge begins on 1 October, 2007. Register now to be alerted before the game starts.

BURSA PURSUIT is a good portal for you to challenge your investment skill. For those no investment experience people also can gain the investment practice. No risk at all. Don't boggle act now.

Thursday, September 27, 2007

炒股不如买基金

炒股不如买基金:基金投资百事通

* 作者:杨庆明,马曲琦 编著
* 丛书名:
* 出版社:中国经济出版社
* ISBN:9787501779758


内容提要
基金投资也有风险,但同股票相比,在现代社会,基金是更为主流的大众投资品种。
  本书向您充分展示基金投资最充分的理由,最先进的理念,全面介绍最重要的基金相关知识和最专业的基金投资技巧和诀窍。
  无论您过去是否接触过基金,是否已经做好理财计划,读过此书相信对您的个人投资一定会有实际的帮助和重要启发!

目录
第一章 投资理念篇——炒股不如买基金
 1.1 牛市投资新理念:炒股不如买基金
 1.2 稳定的投资回报
 1.3 专业理财的强大优势
 1.4 基金的“无形价值”
 1.5 组合投资与风险分散
......
第二章 基础知识篇——明明白白买基金
 2.1 基金是什么样的产品
 2.2 基金当事人及其关系
 2.3 基金的种类(一)——公司型基金VS契约型基金
 2.4 基金的种类(二)——开放式基金VS封闭式基金
 2.5 基金的种类(三)
 2.6 指数基金
 2.7 10F基金
 2.8 交易所交易基金(ETFS)
 2.9 伞型基金
......
第三章 实战技巧篇——轻轻松松赚大钱
第二节 买卖基金
  3.29 购买基金的途径
  3.30 投资时机选择——买进时机
  3.31 投资时机选择——卖出时机
  3.32 如何进行网上交易操作
  3.33 如何巧用成本平均法
  3.34 如何摊平成本法
  3.35 如何金字塔形操作法
  3.36 如何追涨杀跌法
  3.37 申购、认购有技巧
  3.38 设定基金止损/获利点
  3.39 转换基金,进退自如
  3.40 买基金:牛市买老,熊市买新
  3.41 选择现金分红还是红利再投资
  3.42 高价基金值得买吗?
......

Technical Analysis Tool

To learn stock investment you may need a analysis tool

FREE Stock analysis software
http://www.chartnexus.com/
Snapshot


FREE register
FREE software, no license required
FREE and automatic update to date data (EOD)
FREE 3 year stock history data of KLSE, STI(singapore), BSE (india)
FREE 3 year data of major world indices; Dow Jones Indus., Nikkei 225, Heng Seng, Shanghai Stock Ex., Nasdaq, S&P500...........
10 year history data is RM80. If you want to save cost, 3 year data is efficient.