营收32亿 美元,每股盈利43分。超出华尔街分析家预算的营收31亿 美元,每股盈利40分。营收增加59%比去年同期的20亿,总之面子书还是保持高速成长。
以下的一些数据供参考。他们以GAAP和Non-GAAP来计算,
GAAP= generally accepted accounting principles。 由于Ali没有会计学背景,不能向大家解释。


这个季度,开销增加41%。许多投资者担心,未来开销增加,影响盈利,纷纷抛售股票。
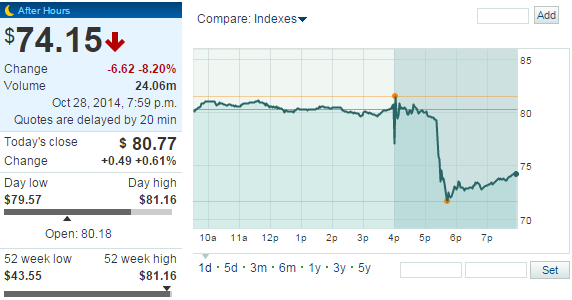
FB股票在28-10-2014闭市后交易(after market trade),一度猛跌10%。
公司最近动向
最近面子书推出新研发“Safety Check”(报平安)按钮。当发生灾难时,向亲人朋友报平安。
还有另一项新研发“Facebook Room”(面书房间),我不是很清楚它的功能,大概是聊天室之类。

面子书创办人朱克柏格(Mark Zuckerberg),22-10-2014造访了中国北京的清华大学,大秀流利中文,让在场眾人为之惊讶。
https://www.facebook.com/video.php?v=10101708164336771&set=vb.4&type=2&theater
以下是facebook的电邮原文及季度报告

Facebook Reports Third Quarter 2014 Results
MENLO PARK, Calif., Oct. 28, 2014 /PRNewswire/ -- Facebook, Inc. (NASDAQ: FB) today reported financial results for the quarter endedSeptember 30, 2014.
"This has been a good quarter with strong results," said Mark Zuckerberg, Facebook founder and CEO. "We continue to focus on serving our community well and continue to invest in connecting the world over the next decade."
Revenue - Revenue for the third quarter of 2014 totaled $3.20 billion, an increase of 59%, compared with $2.02 billion in the third quarter of 2013. Excluding the impact of year-over-year changes in foreign exchange rates, revenue would have increased by 58%.
Income from operations - GAAP income from operations for the third quarter of 2014 was $1.40 billion, up 90% compared to $736 million in the third quarter of 2013. Excluding amortization of intangible assets, share-based compensation and related payroll tax expenses, non-GAAP income from operations for the third quarter of 2014 was $1.82 billion, up 78% compared to $1.02 billion for the third quarter of 2013. Operating margin - GAAP operating margin was 44% for the third quarter of 2014, compared to 37% in the third quarter of 2013. Excluding amortization of intangible assets, share-based compensation and related payroll tax expenses, non-GAAP operating margin was 57% for the third quarter of 2014, compared to 51% for the third quarter of 2013. Provision for income taxes - GAAP income tax expense for the third quarter of 2014 was $530 million, representing a 40% effective tax rate. Excluding amortization of intangible assets, share-based compensation and related payroll tax expenses, the non-GAAP effective tax rate would have been approximately 35%. Net income and EPS - GAAP net income for the third quarter of 2014 was $806 million, up 90% compared to $425 million for the third quarter of 2013. Excluding amortization of intangible assets, share-based compensation and related payroll tax expenses, and income tax adjustments, non-GAAP net income for the third quarter of 2014 was $1.15 billion, up 73% compared to $666 million for the third quarter of 2013. GAAP diluted EPS was $0.30 in the third quarter of 2014, up 76% compared to $0.17 in the third quarter of 2013. Excluding amortization of intangible assets, share-based compensation and related payroll tax expenses, and income tax adjustments, non-GAAP diluted EPS for the third quarter of 2014 was $0.43, up 59% compared to $0.27 in the third quarter of 2013. Capital expenditures - Capital expenditures for the third quarter of 2014 were $482 million. Cash and cash equivalents and marketable securities - Cash and cash equivalents and marketable securities were $14.25 billion at the end of the third quarter of 2014. Free cash flow - Free cash flow for the third quarter of 2014 was $766 million. Webcast and Conference Call Information Facebook will host a conference call to discuss the results at 2 p.m. PT / 5 p.m. ET today. The live webcast of Facebook's earnings release call can be accessed at investor.fb.com, along with the earnings press release, financial tables and slide presentation. Facebook uses theinvestor.fb.com website and Mark Zuckerberg's Facebook Page (https://www.facebook.com/zuck Following the call, a replay will be available at the same website. A telephonic replay will be available for one week following the conference call at +1 (404) 537-3406 or +1 (855) 859-2056, conference ID 11108302. About Facebook Founded in 2004, Facebook's mission is to give people the power to share and make the world more open and connected. People use Facebook to stay connected with friends and family, to discover what's going on in the world, and to share and express what matters to them. Contacts Investors: Deborah Crawford investor@fb.com / investor.fb.com Press: Vanessa Chan press@fb.com / newsroom.fb.com Forward Looking Statements This press release contains forward-looking statements regarding our future business expectations, which are subject to the safe harbor provisions of the Private Securities Litigation Reform Act of 1995. These forward-looking statements are only predictions and may differ materially from actual results due to a variety of factors including: our ability to retain or increase users and engagement levels; our reliance on advertising revenue; our ability to continue to monetize our mobile products; risks associated with new product development and their introduction as well as other new business initiatives; our emphasis on user growth and engagement and the user experience over short-term financial results; competition; litigation; privacy and regulatory concerns; risks associated with acquisitions; security breaches; and our ability to manage growth and geographically-dispersed operations. These and other potential risks and uncertainties that could cause actual results to differ from the results predicted are more fully detailed under the caption "Risk Factors" in our Quarterly Report on Form 10-Q filed with the SEC on July 24, 2014, which is available on our Investor Relations website at investor.fb.com and on the SEC website at www.sec.gov. Additional information will also be set forth in our Quarterly Report on Form 10-Q for the quarter ended September 30, 2014. In addition, please note that the date of this press release is October 28, 2014, and any forward-looking statements contained herein are based on assumptions that we believe to be reasonable as of this date. We undertake no obligation to update these statements as a result of new information or future events. Non-GAAP Financial Measures To supplement our consolidated financial statements, which are prepared and presented in accordance with GAAP, we use the following non-GAAP financial measures: revenue excluding foreign exchange effect and advertising revenue excluding foreign exchange effect; non-GAAP costs and expenses; non-GAAP income from operations; non-GAAP net income; non-GAAP diluted shares; non-GAAP diluted earnings per share; non-GAAP operating margin; non-GAAP effective tax rate; and free cash flow. The presentation of these financial measures is not intended to be considered in isolation or as a substitute for, or superior to, financial information prepared and presented in accordance with GAAP. Investors are cautioned that there are material limitations associated with the use of non-GAAP financial measures as an analytical tool. In particular, many of the adjustments to our GAAP financial measures reflect the exclusion of items, specifically amortization of intangible assets, share-based compensation expense, and payroll tax related to share-based compensation expense, and the related income tax effects of the aforementioned exclusions, that are recurring and will be reflected in our financial results for the foreseeable future. In addition, these measures may be different from non-GAAP financial measures used by other companies, limiting their usefulness for comparison purposes. We compensate for these limitations by providing specific information regarding the GAAP amounts excluded from these non-GAAP financial measures. We believe these non-GAAP financial measures provide investors with useful supplemental information about the financial performance of our business, enable comparison of financial results between periods where certain items may vary independent of business performance, and allow for greater transparency with respect to key metrics used by management in operating our business. We exclude the following items from one or more of our non-GAAP financial measures: Amortization of intangible assets. We amortize intangible assets acquired in connection with acquisitions. We exclude these amortization expenses because we do not believe these expenses are reflective of ongoing operating results in the period. These amounts arise from our prior acquisitions and have no direct correlation to the operation of our business. Share-based compensation expense. We exclude share-based compensation expense because we believe that the non-GAAP financial measures excluding this item provide meaningful supplemental information regarding operational performance. In particular, because of varying available valuation methodologies, subjective assumptions and the variety of award types that companies can use under FASB ASC 718, we believe that providing non-GAAP financial measures that exclude this expense allows investors the ability to make more meaningful comparisons between our operating results and those of other companies. Accordingly, we believe that excluding this expense provides investors and management with greater visibility to the underlying performance of our business operations, facilitates comparison of our results with other periods, and may also facilitate comparison with the results of other companies in our industry. Payroll tax expense related to share-based compensation. We exclude payroll tax expense related to share-based compensation expense because, without excluding these tax expenses, investors would not see the full effect that excluding share-based compensation expense had on our operating results. These expenses are tied to the exercise or vesting of underlying equity awards and the price of our common stock at the time of vesting or exercise, which factors may vary from period to period independent of the operating performance of our business. Similar to share-based compensation expense, we believe that excluding this payroll tax expense provides investors and management with greater visibility to the underlying performance of our business operations and facilitates comparison with other periods as well as the results of other companies. Income tax effect of amortization of intangible assets, share-based compensation and related payroll tax expenses. We believe excluding the income tax effect of non-GAAP adjustments assists investors and management in understanding the tax provision related to those adjustments and provides useful supplemental information regarding the underlying performance of our business operations. Foreign exchange effect on revenue. We translate revenue for the three and nine months ended September 30, 2014 using prior year exchange rates for our settlement currencies, which we believe is a useful metric that facilitates comparison to our historical performance. Purchases of property and equipment; Property and equipment acquired under capital leases. We subtract both purchases of property and equipment and property and equipment acquired under capital leases in our calculation of free cash flow because we believe that these two items collectively represent the amount of property and equipment we need to procure to support our business, regardless of whether we finance such property or equipment with a capital lease. We believe that this methodology can provide useful supplemental information to help investors better understand underlying trends in our business. For more information on our non-GAAP financial measures and a reconciliation of such measures to the nearest GAAP measure, please see the "Reconciliation of Non-GAAP Results to Nearest GAAP Measures" table in this press release.
| |||||||||||||||||||||||||||||||||||||||||||||||||||||||||||||||||||||||||||||||||||||||||||||||||||||||||||||||||||||||||||||||||||||||||||||||||||||||||||||||||||||||||||||||||||||||||||||||||||||||||||||||||||||||||||||||||||||||||||||||||||||||||||||||||||||||||||||||||||||||||||||||||||||||||||||||||||||||||||||||||||||||||||||||||||||||||||||||||||||||||||||||||||||||||||||||||||||||||||||||||||||||||||||||||||||||||||||||||||||||||||||||||||||||||||||||||||||||||||||||||||||||||||||||||||||||||||||||||||||||||||||||||||||||||||||||||||||||||||||||||||||||||||||||||||||||||||||||||||||||||||||||||||||||||||||||||||||||||||||||||||||||||||||||||||||||||||||||||||||||||||||||||||||||||||||||||||||||||||||||||||||||||||||||||||||||||||||||||||||||||||||||||||||||||||||||||||||||||||||||||||||||||||||||||||||||||||||||||||||||||||||||||||||||||||||||||||||||||||||||||||||||||||||||||||||||||||||||||||||||||||||||||||||||||||||||||||||||||||||||||||||||||||||||||||||||||||||||||||||||
不错,以后要买美国股可以找你商量。我打算以后在我打算去旅游的国家买股票,然后在该国的股票赚到钱后,就去该国旅游,那么就能省掉外汇转换的麻烦。
ReplyDelete可以大家研究研究。现在你有买美股吗?去旅游的国家买股票,听起来不错,但是如果十个国家,那就十个户头,要管理多户头,麻烦。
Delete现在还没有,我的火候还未到家,还是支持国货,专注于bursa。我向来都喜欢有建设性的交流,你可以打016-6071100来联络我
ReplyDelete